Why Most Competitive Analyses Fall Flat
The standard UX competitive analysis process goes something like this: visit 5–10 competitor websites, screenshot their key pages, paste the screenshots into a Google Slides deck or Figma file, add some bullet-point observations, and present it to the team. The whole thing takes 3–4 hours and produces a document that's outdated the moment a competitor ships an update.
The deeper problem is that screenshots strip away the things that actually differentiate one website from another. You can't see how a competitor's navigation responds on mobile. You can't test whether their checkout flow has friction. You can't feel the timing of their scroll animations or hover transitions. You're analyzing web design by looking at photographs of web design — and losing most of the signal in the process.
This guide walks through a different approach: running competitive analysis on an interactive canvas where every competitor's website stays fully functional, scrollable, and testable throughout the entire research process.
Setting Up Your Competitive Analysis Canvas
The workflow starts with Bookmarkify, which saves websites as live, interactive previews inside an iframe. When you bookmark a competitor's site, it doesn't become a static image — it stays fully functional. You can scroll through it, click navigation elements, test forms, and check responsive behavior, all without leaving your canvas.
Here's how to structure the analysis from start to finish.
Step 1: Define Your Competitive Set
Before saving anything, decide which competitors to analyze and what specifically you're evaluating. A focused analysis of 5–7 competitors across 2–3 specific dimensions produces more useful insights than a broad survey of 15 competitors across everything.
Common dimensions for UX competitive analysis include: navigation patterns and information architecture, onboarding and first-use experience, key conversion flows (signup, checkout, upgrade), content layout and visual hierarchy, responsive behavior across breakpoints, and micro-interactions and animation approach.
Write down your dimensions before you start saving competitors. This prevents the "save everything, analyze nothing" trap.
Step 2: Save Competitor Websites to the Canvas
For each competitor, use the Bookmarkify Chrome extension to save their key pages. For most analyses, you'll want: the homepage, a core product or feature page, the pricing page, and one page from their primary conversion flow.
Tag each save with the competitor name and the page type (e.g., "Competitor A — Homepage," "Competitor A — Pricing"). This makes filtering easy when your canvas gets dense.
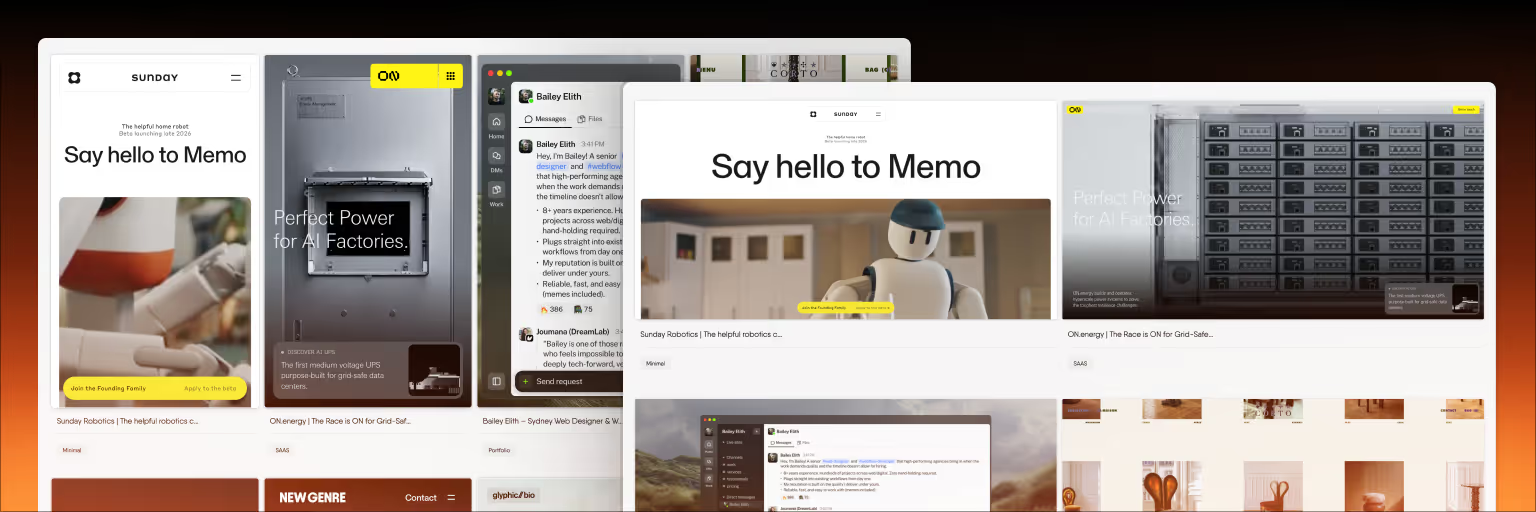
Once saved, switch to canvas mode and arrange your competitors spatially. The most effective layout for comparison is a grid: competitors as columns, page types as rows. This creates a visual matrix where you can scan across competitors for the same page type, or down a single competitor to see their full experience.
Step 3: Analyze Interactively
This is where the interactive canvas changes the game. Instead of staring at screenshots and trying to remember what the site felt like, you can actually use each competitor's site right on the canvas.
Test navigation patterns. Scroll through each competitor's homepage and watch how their navigation behaves. Does it stick to the top? Does it collapse on scroll? How does the mobile menu work? With live previews, you can switch to Bookmarkify's mobile view mode and test each competitor's responsive navigation side by side — something that's impossible with screenshots.
Compare visual hierarchy. Zoom out on the canvas to see all competitors at a glance. Which sites draw your eye first? Where do they place their primary CTA? How do they handle the transition from hero section to content? Seeing multiple live sites simultaneously reveals patterns that viewing them one-at-a-time in browser tabs doesn't.
Study micro-interactions. Hover over buttons, form fields, and interactive elements on each competitor's site. Note the transition speeds, easing curves, and feedback patterns. These details define the perceived quality of a product but are completely invisible in static analysis.
Extract design specifics. Use Bookmarkify's Design Analyse feature to pull fonts, colors, gradients, and assets from each competitor's site. This gives you concrete data — specific hex values, font families, and spacing patterns — rather than vague observations like "they use a lot of blue."
Step 4: Annotate Findings
As you analyze, use the canvas note tool to capture observations directly alongside the references they relate to. Good competitive analysis notes are specific and actionable:
Instead of: "Competitor B has good navigation."
Write: "Competitor B's nav collapses to a hamburger at 768px with a full-screen overlay menu. The animation is a slide-down at roughly 300ms with ease-out. Our current nav breaks at 768px with no transition — consider adopting their breakpoint and adding a smooth transition."
Use the connect tool to draw lines between notes and the specific sites they reference. Link observations across competitors when you spot shared patterns. These connections turn scattered observations into a structured analysis.
Step 5: Identify Patterns and Gaps
After annotating individual competitors, zoom out and look for patterns across the full canvas. Common patterns to identify include:
Industry conventions — what do most competitors do the same way? These represent user expectations you probably shouldn't violate without good reason.
Differentiation opportunities — where do all competitors follow the same approach, creating an opening for a different solution? If every competitor uses a traditional hamburger menu on mobile, maybe there's room for a bottom navigation pattern.
Best-in-class examples — which competitor handles a specific dimension better than everyone else? These become direct references for your design work.
Common weaknesses — what do most competitors do poorly? Slow load times, confusing pricing pages, poor mobile experiences — these represent areas where your product can win by simply executing the basics well.
Step 6: Share and Present
Share your canvas via Bookmarkify's unique URL sharing. The person receiving the link gets the same interactive experience — they can scroll through competitor sites themselves, read your annotations, and follow the connections you've drawn. This is dramatically more useful than a slide deck of screenshots, because stakeholders can form their own observations from live sites rather than relying solely on your interpretation.
For live presentations, share your screen and walk through the canvas. Zoom into specific competitors, scroll through their pages live, and point out the patterns you've identified. The ability to interact with competitor sites in real-time during a presentation makes the analysis feel current and credible rather than like a historical document.
Competitive Analysis Dimensions: What to Compare
Not every analysis needs to cover every dimension. Choose 2–4 based on what's most relevant to your current project. Here are the dimensions that benefit most from interactive analysis:
Navigation and information architecture: How do competitors structure their site? What's in the main nav vs. footer? How deep is the page hierarchy? How does navigation adapt across breakpoints? Interactive previews let you test all of this directly.
Onboarding and first impressions: What does the homepage communicate in the first 5 seconds? What's the primary CTA? How many steps to sign up? Live sites let you actually walk through the signup flow.
Content strategy and hierarchy: How do competitors structure their content pages? What's above the fold? How do they handle long-form content? Scrolling through live pages reveals the full content experience.
Responsive design: How do competitor sites adapt to mobile? Bookmarkify's mobile preview mode lets you check every competitor's mobile experience without switching devices — this is one of the most valuable capabilities for competitive analysis.
Visual design language: What colors, typography, and spacing patterns define each competitor's brand? Design Analyse extracts these specifics automatically.
How This Compares to Traditional Methods
The traditional competitive analysis workflow — screenshots in a slide deck — works when you need a quick, shareable overview. It's fast to produce and easy to distribute. But it sacrifices depth for convenience.
An interactive canvas analysis takes roughly the same time to produce (often less, since you skip the screenshot-paste-annotate loop) but preserves the full richness of each competitor's experience. The tradeoff is that the output lives on a canvas rather than in a PDF — it's more useful for working designers but less convenient for stakeholders who want something they can read on a plane.
The ideal approach for most teams: run the interactive analysis on the canvas for your own design work, then distill the key findings into a brief summary document for stakeholders who won't interact with the canvas directly.
Frequently Asked Questions
How many competitors should I include in a UX competitive analysis?
Five to seven competitors is the sweet spot for most projects. Include 2–3 direct competitors (products targeting the same users with similar features), 1–2 indirect competitors (different products solving the same underlying need), and 1–2 aspirational references (best-in-class sites from adjacent industries). More than 10 competitors dilutes focus; fewer than 4 may not reveal enough patterns.
Can I do competitive analysis with Bookmarkify's free plan?
Yes. The free plan includes canvas mode and up to 12 bookmarks, which is enough for a focused analysis of 3–4 competitors with 3–4 pages each. For larger analyses covering more competitors or page types, the Pro plan removes the bookmark limit.
How often should I update a competitive analysis?
For fast-moving markets like SaaS and e-commerce, quarterly reviews catch meaningful changes without becoming a time sink. For more stable industries, twice a year is sufficient. The advantage of an interactive canvas is that updating is simple — re-save competitor pages that have changed and your analysis reflects the current state without rebuilding from scratch.
What's the difference between UX competitive analysis and a design audit?
A competitive analysis compares multiple competitors to identify patterns, gaps, and opportunities in the market. A design audit evaluates a single product against established UX principles and best practices. They serve different purposes: competitive analysis informs positioning and differentiation; design audits inform improvement of an existing experience. Both benefit from interactive reference materials.
How do I present competitive analysis findings to non-designers?
Share the canvas URL so stakeholders can explore live competitor sites themselves, then pair it with a one-page summary of your top 3–5 findings. Non-designers respond best to specific, comparative observations: "4 of 5 competitors put pricing in the main nav; we bury it in the footer" is more persuasive than abstract UX commentary. The interactive canvas gives them the evidence; the summary gives them the conclusions.